TermiLoop — FT8 TX Spot Maps (Field Check)
Updated: 2025-08-29 — FT8 transmit checks with TermiLoop 100W.
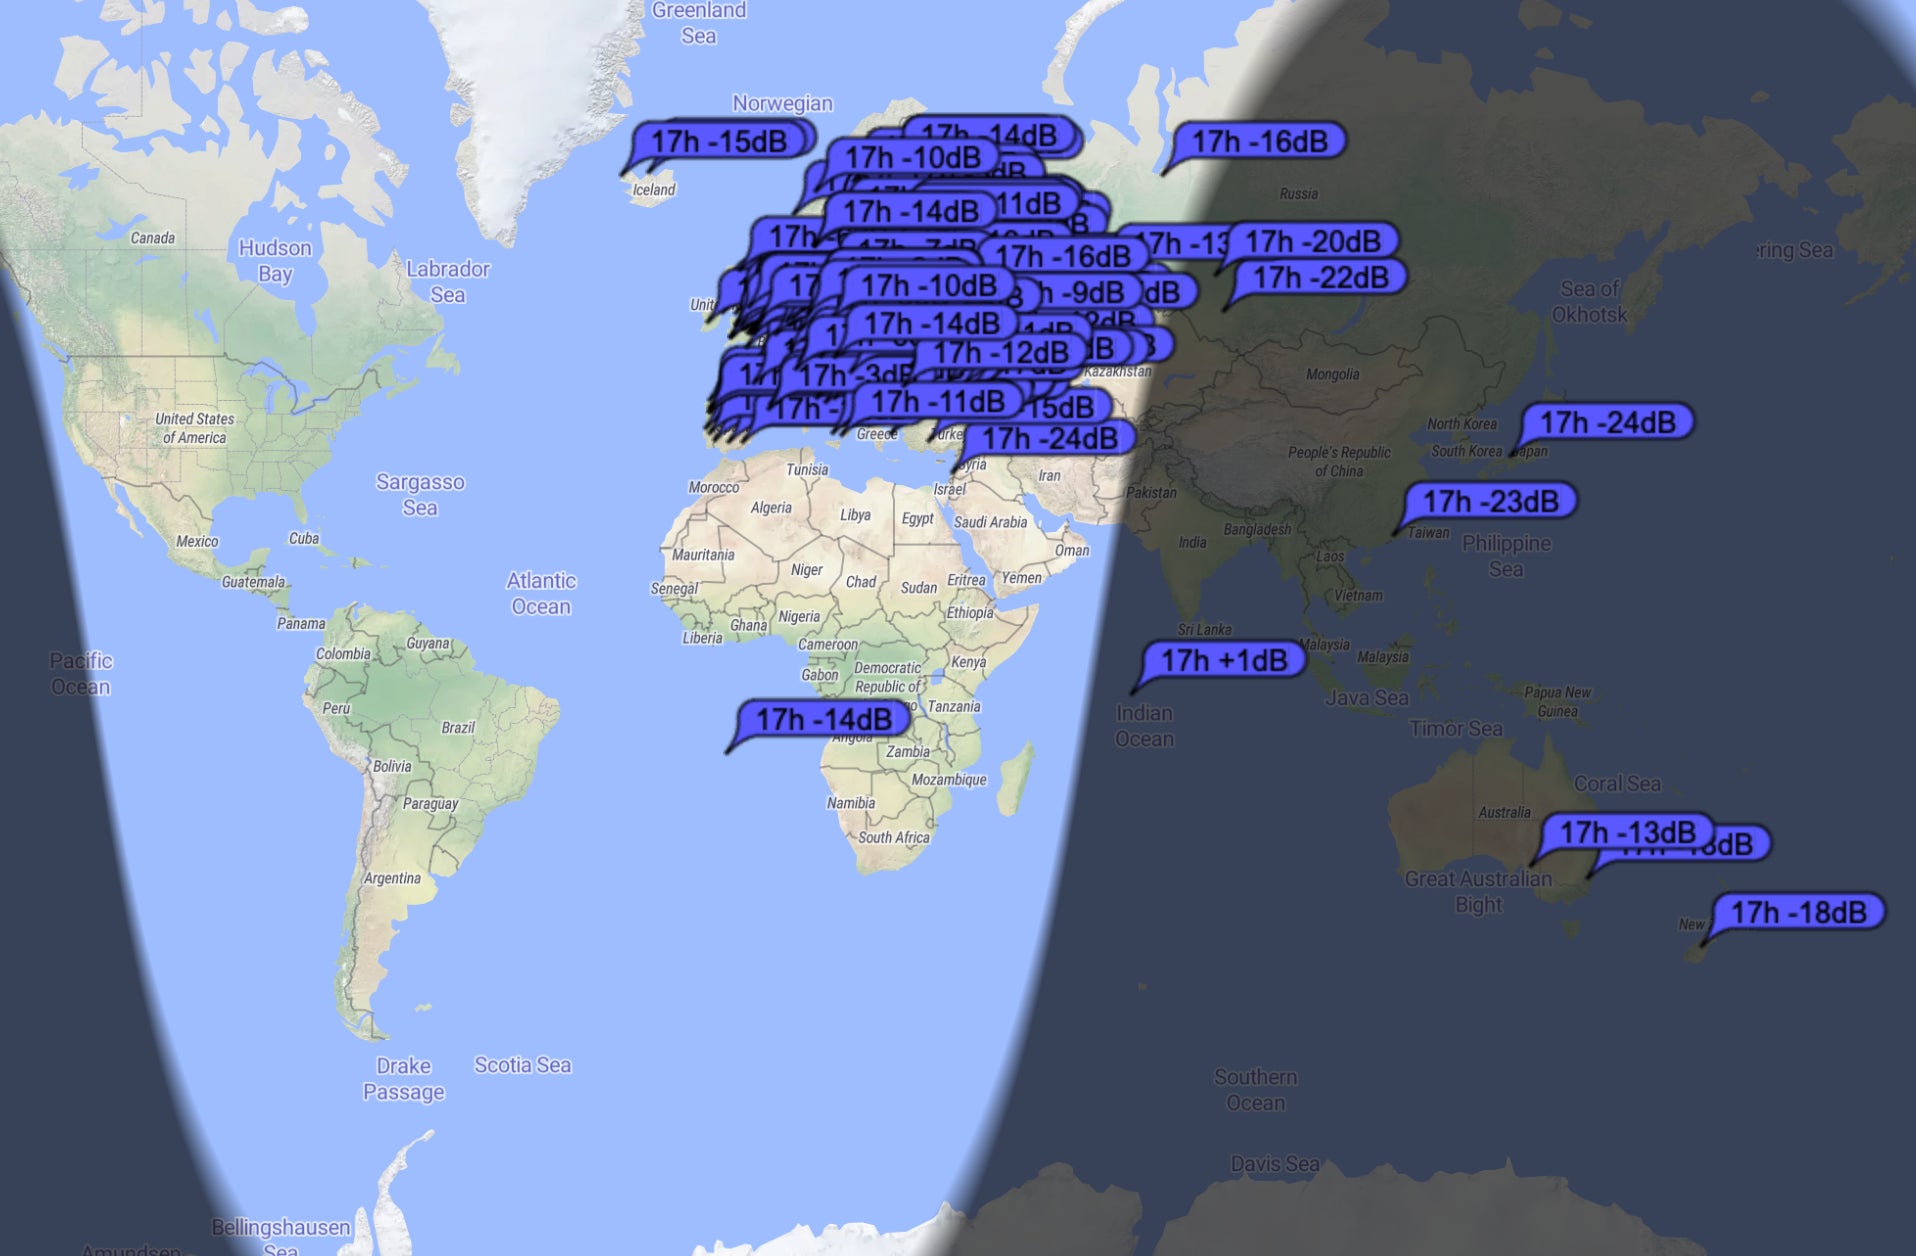
Quick-look transmit coverage snapshots per HF band using FT8 on today’s session. These images show typical FT8 reception reports aggregated during short test windows. Installation, propagation, and power vary by site; treat these as indicative patterns rather than absolute performance.
160 m — FT8 TX Reach

80 m — FT8 TX Reach

60 m — FT8 TX Reach

40 m — FT8 TX Reach

30 m — FT8 TX Reach

20 m — FT8 TX Reach

17 m — FT8 TX Reach

15 m — FT8 TX Reach

12 m — FT8 TX Reach

10 m — FT8 TX Reach

Mini-FAQ
- Are these absolute performance charts? — No. They’re indicative FT8 spot maps from today’s tests with a TermiLoop. Your installation and conditions will differ.
- What power was used? — Typical FT8 drive levels for clean TX; keep ALC minimal and ensure your RF chain is linear.
- Why do my results differ? — Noise floor, antenna height/orientation, ground, propagation, and local QRM all shift outcomes.
Interested in more technical content? Subscribe to our updates for deep-dive RF articles and lab notes.
Questions or experiences to share? Feel free to contact RF.Guru.